WEIGHTED LEAST SQUARES METHOD
WEIGHTED LEAST SQUARES WITH EXAMPLES

what is weighted least square:
- Weighted least square regression , also known as weighted linear regression , is a generalization of ordinary least squares and linear regression in which knowledge of the variances of observations is incorporated into the regression.
- It’s an extension of ordinary least squares regression. Non – negative constants ( weights) are attached to data points .
- It’s handle cases where data quality varies .i.e., one of the common assumptions underlying most process modelling methods , including linear and non linear least square regression ,is that each data point provides equally precise information about the deterministic part of the total process variation.
- In weighted fit , less weight is given to the less precise measurements and more weight to more precise measurements when estimating the unknown parameters in the model.
- Using weights that are inversely proportional to the variance at each level of the explanatory variables yields the most precise parameter estimates possible.
- weighting the sum of the squares of the different may significantly improve the ability of the least squares regression to fit the linear model to the data.
- The mathematics used in unweighted least square regression has a tendency to favor numbers of larger value over number of smaller value .
TYPES OF WEIGHTS :
- No weight
- 1/ Amount
- 1/ Amount ^2
- 1/ Response
- 1/ Response ^2
- 1/ RSD
- 1/RSD².
ADVANTAGES:
- It’s an efficient method that makes good use of small data sets. It also shares the ability to provide different types of easily interpretable statistical intervals for estimation , prediction, calibration and optimization.
- The main advantage that weighted least squares enjoys over other methods is the ability to handle regression situations in which data points are of varying quality.
DISADVANTAGES:
- The biggest disadvantage of WLS , is probably the fact that the theory behind this method is based on the assumption that the weight are known exactly.
- The exact weights are almost never known in real applications, so estimated weights must be used instead.
- The effect of using estimated weights is difficult to assess , but experience indicates that small variations in the weights due to estimation do not often affect a regression analysis ( or) it’s interpretation.
FORMULA’S :
- WLS estimates are obtained by minimizing are opposed to minimizing
- weighted least square is equivalent to performing OLS on the transformed variables Y/ alpha and 1/ alpha
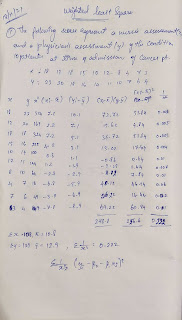
EXAMPLE WITH SOLVED MANUAL CALCULATIONS:
The following scores represent a nurses assessment (X), and a physician’s assessment (Y) of the conditions 10 patients at time of admission of cancer hospital.
X= 18 13 18 15 10 12 8 4 7 3
Y= 23 20 18 16 14 11 10 7 6 4
SOLUTIONS:


NORMAL WLS SCATTER DIAGRAM:

More about statistics:


Comments
Post a Comment